
A health and wellness e-commerce platform was opening a winter flash sale at midnight the next day. Marketing was ready and the business side expected a clear traffic lift. The tester opened a load testing tool, configured 3,000 virtual users and ran a round: response times within target, error rate very low, the application running smoothly, so the conclusion came back – performance passes, we can ship.
The moment midnight arrived, thousands of users poured in at once, product pages stopped responding, checkout requests failed one after another, and finally the application crashed entirely.
The load test did run, and the report really was green. The problem is that the round proved only “the application can still run with 3,000 virtual users configured”; it did not answer “can the whole system absorb the traffic the business expects”. What sits between those two questions is not more virtual users but a few estimates that should have been done before testing began. In engineering this kind of rough arithmetic is called back-of-the-envelope calculation: not aiming for precision, just getting the magnitude, the headroom and the likely bottleneck onto the table before you start.
One: The First Estimate – Peak Is Not Average
The business side says “we expect 5,000 customers in one hour”. Spread over 3,600 seconds that is about one person per second, which sounds effortless. But promotional traffic is never evenly distributed: if those 5,000 all arrive in the five minutes before the opening, the average arrival rate in those five minutes is about 10 per second; and even “average” understates the real shape – several hundred requests arriving within two or three seconds.
Treating the average as the load test model is the most common and most insidious mistake. It makes the script look reasonable while leaving the system completely untested during the tens of seconds it most needs to survive.
Before testing, at least these questions must be answered clearly and written into the scenario design:
- What is the expected total traffic, and on what basis – sign-ups, historical data for the same event, or a marketing estimate?
- What is the expected number of concurrent users, rather than “how many people will come within an hour”?
- What is the possible peak in the first few minutes, and at what magnitude is the per-second burst estimated?
- Have all four scenario classes been run: normal load, peak load, spike load and beyond-limit stress?
- Does user behaviour in the script resemble real customers – browsing, adding to cart, changing quantity, checking out – or does it hit the checkout API immediately?
- Is “simultaneous” simulated, not just “high frequency”?
The tool’s job is only to generate traffic; whether the scenario represents the real business is a human responsibility. The output of this step should not be a thread count but a set of scenario descriptions with assumptions attached.
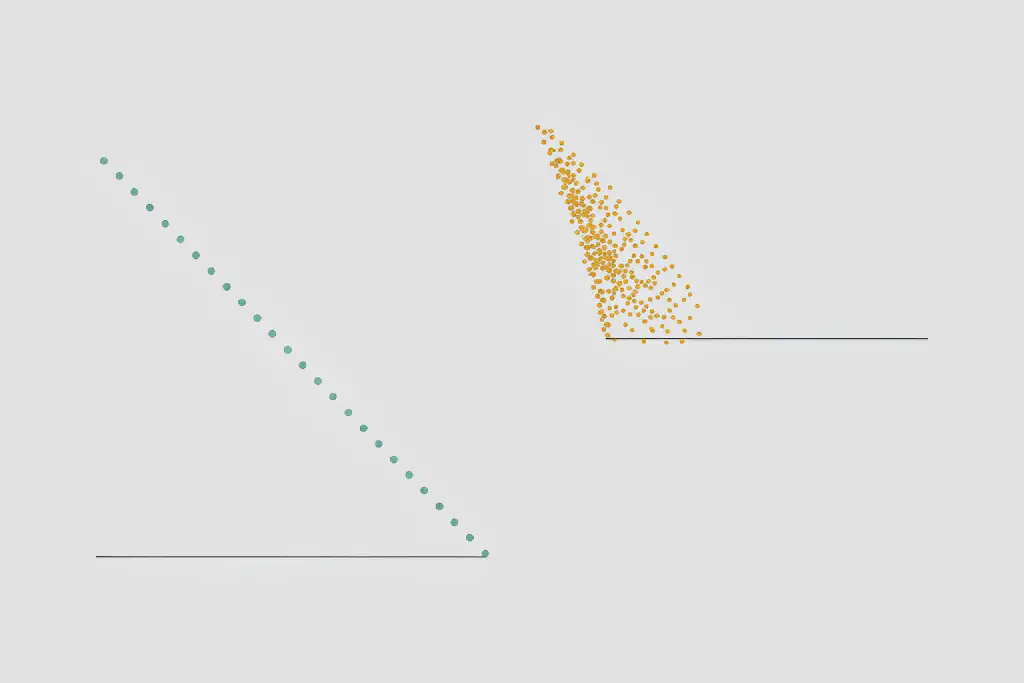
Spreading “5,000 people in an hour” into an average versus modelling the five-minute opening spike produces two completely different load test scripts
Two: The Second Estimate – Is There Enough Memory Headroom
A shop that can hold 3,000 people suddenly takes 5,000: the door jams first, then the whole shop stops working. Application servers are the same: every active request and session occupies memory and CPU, and those resources have hard limits.
The rough calculation is plain; put three numbers side by side and the risk appears: available machine memory, average memory cost per active request, peak concurrent requests. An order-of-magnitude example: 8 GB available memory, about 9 MB per request, 3,000 concurrent requests means the requests alone are in the 27 GB range, already far beyond this machine’s capacity. Even if the real cost is lower than that product because of reuse, caching and connection pooling, the conclusion does not change – server capacity can become the bottleneck before expected traffic reaches its peak, and it usually is not “calculated” but announced by OOM logs.
Once resources are exhausted, the system does not simply slow down but goes through a chain reaction: memory usage keeps climbing, response times degrade first, requests start timing out or failing, and finally the process is killed for running out of memory. Worse is whether it can recover after load drops – if memory does not fall back, there is a leak, and the second wave of traffic will crash sooner.
So the observation checklist during load testing must cover behaviour, not just “the service is still alive”:
- How much RAM and CPU is available, and what is the baseline before the test?
- How much memory does the application actually consume under load, and is the curve linear as concurrency grows?
- Does memory keep rising and fail to fall back after load drops – is there a leak?
- At which load level does performance start to degrade, and where is the knee?
- Can the application return to baseline after traffic subsides, and how long does recovery take?
The value of these numbers is not in the report but in handing “infrastructure risk” to development and operations early, instead of letting production announce the answer.
Three: The Third Estimate – Can Queues Flatten the Surge
Suppose 5,000 customers add to cart and order at almost the same moment, while the cart and payment paths can only handle 100 requests at a time. Feed all 5,000 in as they are, and overload, checkout latency, payment failures and even duplicate transactions all arrive together.
The role of a queue is to accept tasks suitable for asynchronous handling first and then feed them to workers at a controlled rate. Background operations such as order notifications and inventory updates suit this path; but cart updates and payment authorization generally need immediate processing or immediate confirmation and cannot all be dumped into a queue. Which can be asynchronous and which must be synchronous is itself a design decision that should be settled before load testing, not changed after a problem appears.
A queue has its own limits too. If the enqueue rate stays above the consumption rate, messages pile up; whether it drops, blocks or rejects at maximum capacity depends on configuration and directly determines what users see. The real risk concentrates at the boundary of failure and retry: if a worker crashes halfway, is the message lost? When a failed message is retried, does it produce a second order? If the user clicks pay again after a timeout, is the card charged twice? After the queue is overloaded, can the system recover by itself, and is order state still consistent?
Only some of these can be seen from status codes. What must be verified is the end-to-end result: orders not lost, not duplicated, state consistent, payment not charged twice.

From traffic spikes through memory, queues and database connection pools, four layers of capacity constraint narrow one after another, and any layer can become the real bottleneck
Four: The Fourth Estimate – The Database Connection Pool Is That Single Checkout Counter
5,000 people have picked their items and are ready to pay, and the shop has one checkout counter. Application servers can scale horizontally to thousands of concurrent requests, but the connections and transactions a database can handle at once are often fixed. For example, the application receives 5,000 requests while the connection pool allows only 500 active connections, so the remaining thousands can only queue for a connection, then start timing out, and finally report connection pool exhaustion or connection timeout.
This kind of bottleneck has a special trait: adding application servers does not relieve it, it just pushes more requests onto the same pool. So a load test that only watches API response codes can be green throughout, right up until production fills the pool.
Things to confirm in advance include:
- What is the database’s maximum connection count, and what was the peak used during the test?
- Are connections released correctly after use, and how are the pool’s wait queue and timeout configured?
- Are there slow queries or missing indexes, and do long transactions hold connections for a long time?
- What is the application’s behaviour at the connection ceiling: fast failure, queueing, or dragging down the whole upstream?
- Which repeated reads can be absorbed by a cache, and which background operations can move to a queue?
The conclusion at the database layer is usually not “pass / fail” but an acceptable concurrency ceiling, and whether degradation beyond that ceiling is controllable.
Five: Turning the Four Estimates Into One Page of Pre-Test Checklist
The four estimates actually map onto four parties to ask: the business side gives traffic expectations, development gives architecture and dependency boundaries, operations gives current resources and configuration, and testing assembles the three into scenarios and criteria. The order matters too – align assumptions first, then set thresholds, then run the load test, and finally check recovery.
A pre-test checklist you can use directly:
- Traffic and spikes: what is the expected peak concurrency, are all four load scenario classes present, does the script replicate real user paths?
- Server headroom: memory and CPU baseline, cost per request, the degradation knee, does it recover after load drops?
- Queues and retries: which tasks are asynchronous, the queue limit and full-queue behaviour, will failed retries produce duplicate orders or duplicate charges?
- Database: connection pool ceiling, peak usage, slow queries and indexes, degradation behaviour at connection exhaustion?
- Shared criteria: what are the performance thresholds per layer, is exceeding a threshold a failure or an observation item, and has recovery been verified after the test?
Walking this checklist through with development and operations before the load test makes many bottlenecks surface before the first line of the script is written. They should never have been discovered by production in the first place.
Six: From “Running the Test” to “Owning Readiness”
Knowing how to use a load testing tool, being able to configure virtual users and produce a handsome report – all of that is the execution layer. What really decides whether a big sale crashes is whether someone is willing to understand the business expectation, interrogate the capacity structure behind the system, challenge default assumptions like “average equals peak”, and state risk clearly when information is insufficient.
This does not require becoming a system architect first; it requires asking all the questions that should be asked before the system goes live. What a load test hands over should not be “tests passed” but “we have enough confidence in how the system behaves under expected traffic, and we know where it will break first”.
The tester’s responsibility does not end when the report turns green. It ends when confidence has been built.