An MCP server that starts without errors and one that actually works are two different things. Whether each tool accepts the arguments you think it does, whether the return value has the structure the model expects, and whether a failure counts as a tool error or a protocol error – these are things you often cannot find out by plugging the server into an AI client and asking the model. That chain is slow, and the model sits between you and the bug.
A more direct approach is to take the model out: connect a local web UI straight to the server, list the tools, resources and prompts it provides, call them one by one by hand, and read every JSON-RPC frame in full. Below are the seven steps of one complete debugging session, from startup to connecting your own service.
First, Take the Model Out of the Chain
Most people troubleshoot by connecting a client, sending an instruction and watching the result. The trouble is that when the result is wrong, you cannot tell whether the tool arguments were wrong, the server did not respond, or the model misunderstood.
That is where direct connection pays off: you send the call, you fill in the arguments, and you get the response verbatim. Four questions become decidable – did the tool receive the expected arguments, is the return structure correct, in what form is failure expressed, and is the latency abnormal. The model should only appear in the very last step.
One Command to Start a Local Debugging Console
No install and no build needed:
npx mcp-master-tester
Open http://127.0.0.1:6280 in a browser. If the port is taken, change it:
PORT=7000 npx mcp-master-tester
The backend is Express, the front end is vanilla JavaScript, it starts in seconds and follows the system’s light or dark theme. The only prerequisite is Node.js 20 or newer.
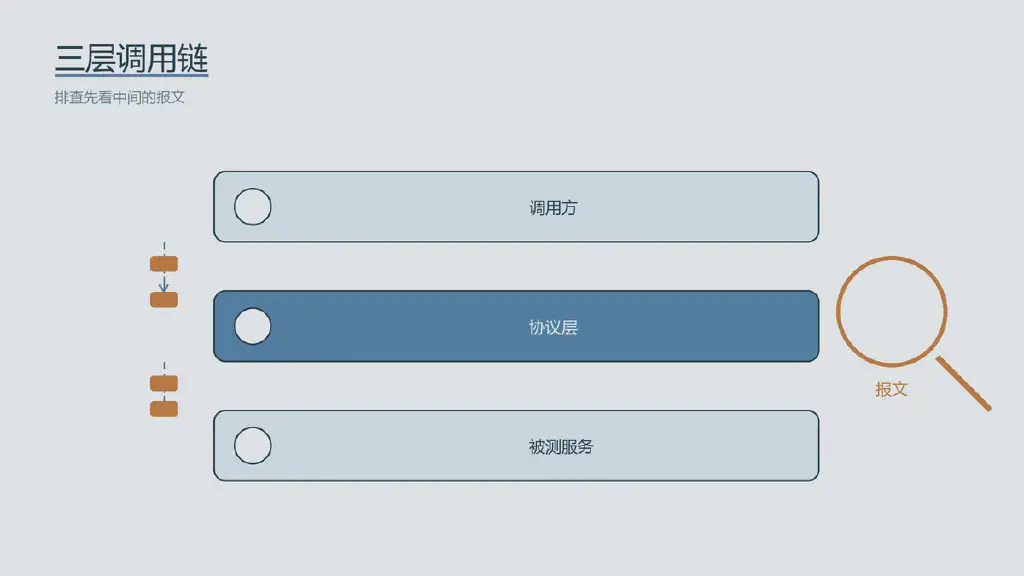 Figure 1 | The three layers of caller, protocol layer and service under test; when troubleshooting, look at the frames in the middle first
Connect the Reference Implementation First to See What a Healthy Service Looks Like
The connection form comes pre-filled with a stdio connection to the official reference server:
npx -y @modelcontextprotocol/server-everything
After clicking connect, the backend launches the server as a child process, completes the initialize handshake, and the sidebar lists all the capabilities it provides: tools, resources, resource templates, prompts.
Connecting the reference implementation rather than your own code first makes sense because it exercises every feature in the protocol. Once you have seen what a healthy service looks like, anomalies in your own service stand out. This step is also good for confirming that your client environment itself is fine.
Forms Are Generated From the Schema, Required Fields Blocked Before Sending
Select a tool and the interface reads its inputSchema to generate a form automatically: strings, numbers and integers become text inputs, booleans become toggles, enum (including oneOf / const with titles) becomes a dropdown, arrays become multi-select, and objects get a JSON editor.
Required fields are validated before the request goes out, so a missing argument is caught at the form layer instead of turning into a vague server error. When the form gets in the way, switch to Edit as JSON and write the arguments directly. Set a timeout for slow tools; long tasks stream progress back through notifications/progress; tools marked destructive ask for confirmation first.
The result viewer breaks the response apart: text (JSON gets formatted), images and audio, resource links and embedded resources, structuredContent, and how long the call took. Each tool also keeps its own call history, so you can rerun with different arguments and compare directly.
Two Kinds of Failure Must Be Looked at Separately
This is the single most memorable point of the whole session. A tool failure can be expressed in two ways:
- Returning a result with
isError: true, meaning the tool ran and reported failure - The call itself throwing a
JSON-RPCerror, meaning the protocol layer broke
The console displays the two separately, and this is not pedantry. If a scenario that should return isError instead throws a protocol error, the model on the other end gets far less information and may well just see a failure without knowing why. This is listed as one of the most common bugs in MCP servers and deserves its own line in your self-test checklist.
Resources, Prompts and Mid-Call Elicitation
Static resources are read with one click. Resource templates with variables (of the form file:///{path}) give each variable an input box, and you read after filling them in; both text and blob content can be displayed, so you can confirm a binary resource was not corrupted in transit.
Prompts work the same way: select one, fill in the arguments, and the interface shows the full message the template returns – the fastest way to check that argument substitution behaves as expected.
Some servers ask the user for information mid-call through elicitation/create. The console generates a form from the requestedSchema, sends your answer back, and also supports URL mode. If your service uses elicitation, this is the simplest way to test the full round trip without connecting a real client.
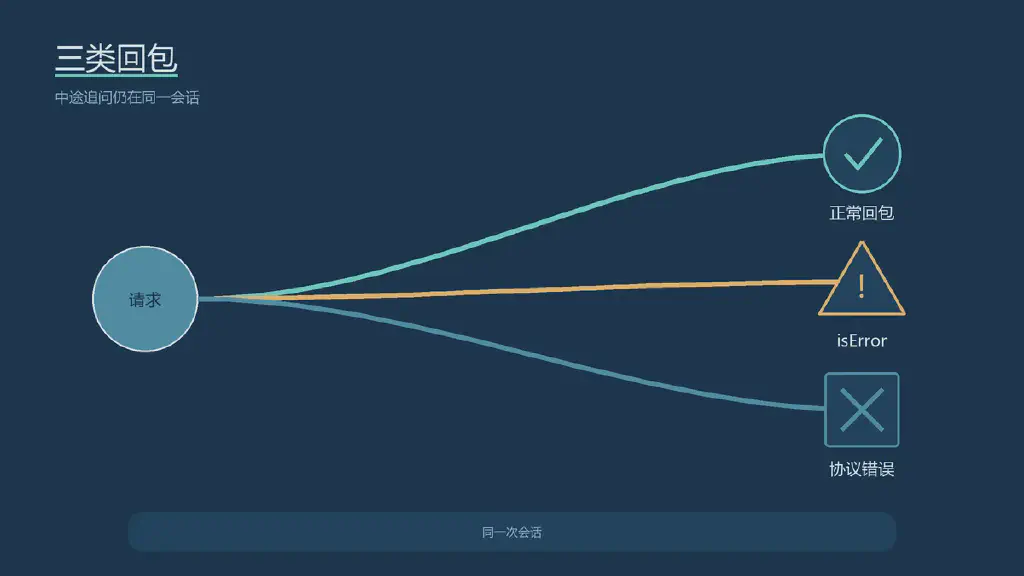 Figure 2 | Distinguishing the three branches of a normal response,
isError and a protocol error, with mid-call elicitation still inside the same session
When the Result Looks Wrong, Read the Frames Before the Code
The protocol log records from oldest to newest: every JSON-RPC frame in both directions, request-to-response latency, the server’s stderr, notifications/message log entries, and it can adjust the server log level with logging/setLevel.
Order matters. When a result looks wrong, read the raw frames before going back to your code: what exactly did the client send, did the server respond, how long did it take. A lot of “the tool is broken” turns out to be a mismatch you can see at a glance here – a misspelled argument name, a missing field in the response, or a process crash that dumped its stack to stderr.
It Can Work Manually and Still Be Misused by the Model
A tool can be called perfectly by hand and still be misused by a model, because the model only knows what is written in the definition. The Lint report checks every tool definition against the specification and good practice:
inputSchemaandoutputSchemamust be of type object- Every required field must actually be defined
- properties should carry a type and a description
- Tool names must be well formed and unique
- Tools should carry annotations (for example whether they are read-only or destructive)
Lint results should be treated as bugs: without a description, the model can only guess what an argument is for; without annotations, the client cannot warn the user before a destructive operation. Fix the definition, reconnect, run lint again, until it is clean.
Connecting Your Own Service
Choose the connection method by deployment shape:
- Local npm package (
stdio): commandnpx, arguments-y @modelcontextprotocol/server-filesystem /path/to/dir - Local script (
stdio): commandpython, argumentsmy_server.py, plus a working directory if needed - Needs a secret (
stdio): click+ var, for exampleGITHUB_PERSONAL_ACCESS_TOKEN - Remote, current spec (
Streamable HTTP): enterhttps://host/mcp, with a Bearer token if needed - Remote, older spec (
SSE): enterhttps://host/sse
Remote traffic is relayed through the Node backend and will not hit browser CORS. There are fallbacks when credentials are missing: a remote 401 prompts you to enter a token and retry; a stdio process that crashes with stderr mentioning a missing secret gets a suggestion to add it as an environment variable and reconnect; variables whose names contain KEY, TOKEN, SECRET or PASSWORD are masked automatically.
Once connected you can save it as a profile, but profiles store only names and not secrets, so you still re-enter them on each connection.
The Boundaries of a Local Tool
This console can execute any command you type into the stdio form, so it is deliberately kept local by design: the backend listens only on 127.0.0.1 and rejects any request whose Host header is not the local machine or localhost (blocking DNS rebinding from malicious sites), secrets exist only in the browser tab and the backend process memory, and nothing executes before you click Run.
Two gaps to keep in mind: the OAuth login flow for remote servers is not yet supported, so you need a Bearer token or custom headers; and sampling/createMessage and roots are not declared to the server.
The Fixed Routine After Every Change
Connect, run lint, call each changed tool once, and scan the protocol log for errors and slow responses – these four steps can be codified as the closing routine for every server change.
What it solves is really a plain problem: debugging an MCP server should not require dragging a model into the loop. Calls are direct, arguments are generated from the schema, frames are visible one by one, definitions are checked against the specification, and the description the model relies on gets verified along the way.
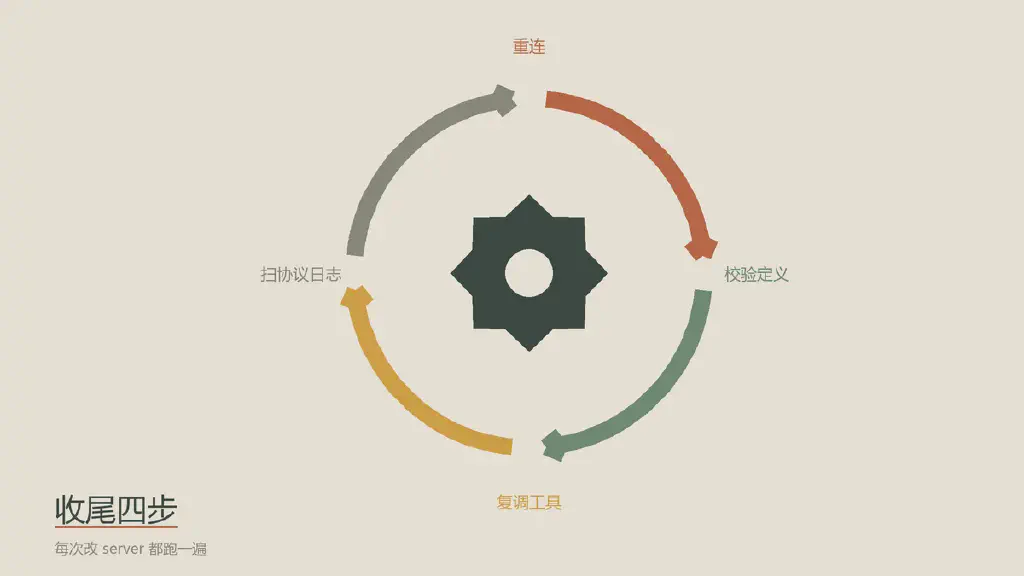 Figure 3 | Reconnect, validate definitions, re-call changed tools and scan the protocol log – a repeatable closing routine