In previous articles, we introduced various browser AI automation tools such as Playwright-mcp, browser-use, and midsceneJs; each can well drive a browser to complete automated tasks based on AI large models.
Recently, Google officially launched the devtools mcp for the Chrome browser, further enriching the tools for driving a browser to complete intelligent tasks through AI, including executing automated test scripts.
In short, DevTools MCP is Google exposing the underlying devtools methods of the Chrome browser, based on the MCP (Model Context Protocol) standard, to AI large language models (LLMs) as a service, enabling AI large models to call the underlying debugging tools of the Chrome browser.
For a detailed introduction to MCP, see my previous article 【】
The tool uses a layered architecture, mainly including the following modules:
- MCP Server layer: Responsible for receiving MCP requests from the LLM/agent, and performing session management and permission control.
- Tool adaptation layer: Maps MCP’s high-level requests to the Chrome DevTools Protocol (CDP) or Puppeteer API, and manages long tasks (such as recording/tracing).
- Chrome runtime: A real Chrome/Chromium instance (headful or headless) that performs all underlying operations and produces trace, performance, console, and other data.
- Data collection and transmission: Serializes the collected trace, stack, HAR, snapshots, and other data, and returns it to the caller via MCP.
The specific calling process is shown below:

The underlying methods currently exposed by DevTools MCP mainly fall into the following six categories:
| Category | Count | Main Functions |
|---|
| Input automation | 7 | click, drag, fill, fill_form, handle_dialog, hover, upload_file |
| Navigation automation | 7 | close_page, list_pages, navigate_page, navigate_page_history, new_page, select_page, wait_for |
| Performance | 3 | performance_analyze_insight, performance_start_trace, performance_stop_trace |
| Debugging | 4 | evaluate_script, list_console_messages, take_screenshot, take_snapshot |
| Network | 2 | get_network_request, list_network_requests |
| Emulation | 3 | emulate_cpu, emulate_network, resize_page |
Installation and Usage
The tool is open-sourced on GitHub at:
https://github.com/ChromeDevTools/chrome-devtools-mcp
Compared with other tools, configuration and installation are extremely simple, and the homepage also provides quick configuration for various mainstream AI terminals.
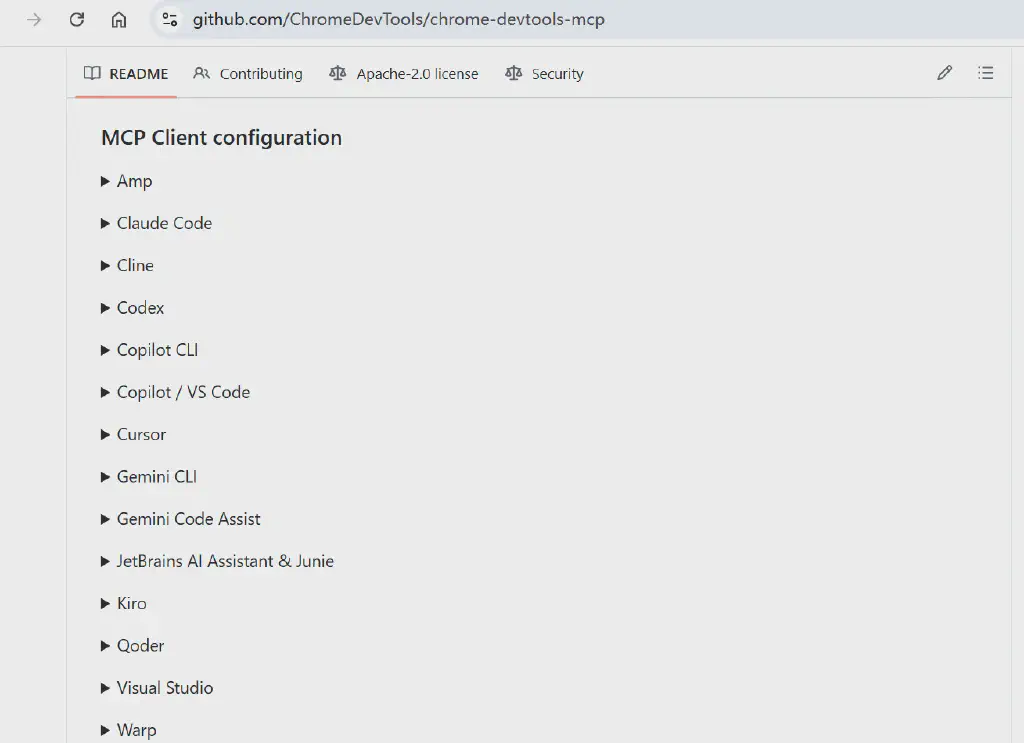
Taking Cursor as an example, in its MCP configuration page, add the following configuration:
1
2
3
4
5
6
7
8
9
|
{
  "mcpServers": {
    "chrome-devtools": {
      "command": "npx",
      "args": ["-y", "chrome-devtools-mcp@latest"]
    }
  }
}
|
Just make sure Node.js is installed locally and can connect to the node package management server.
After configuration, wait for dev tools to load successfully and show the supported methods, as shown below.
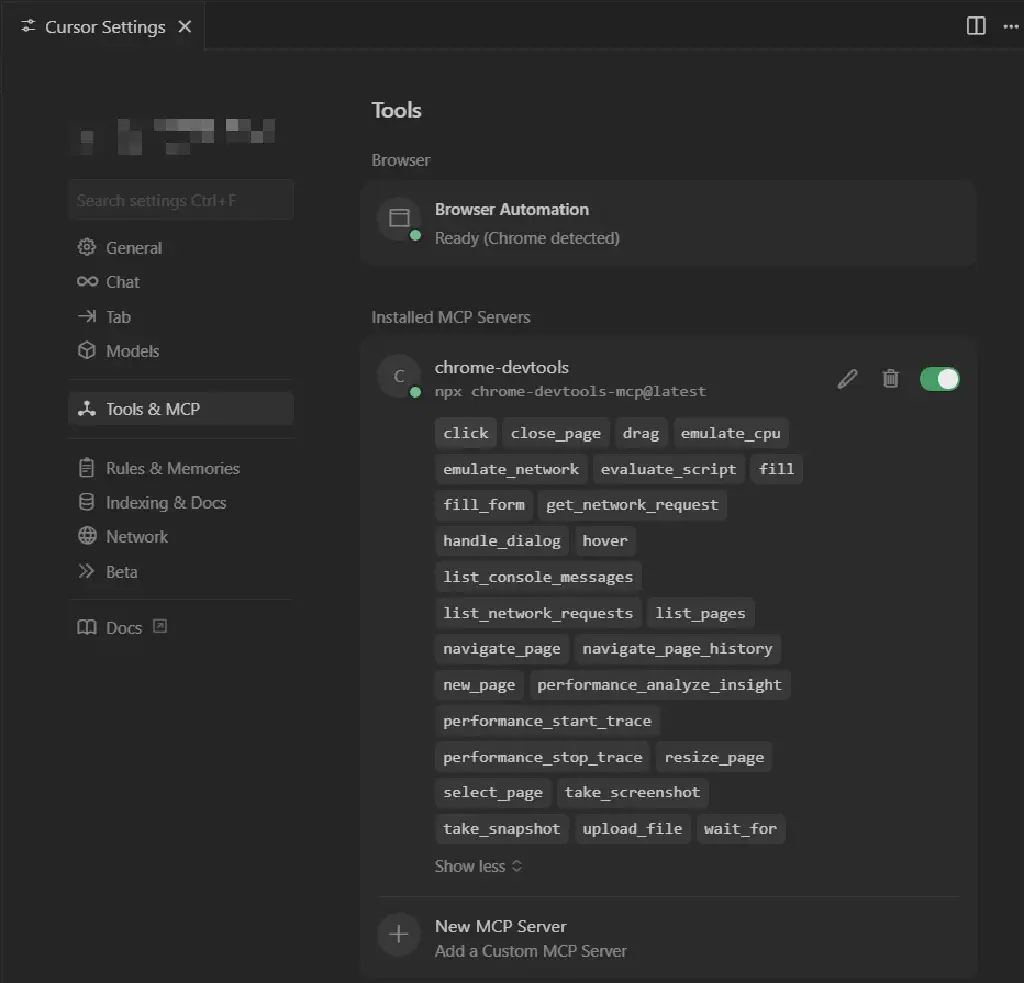
Executing Automated Testing
Let’s test it with a typical automation task. Enter the prompt in Cursor:
1
2
|
Visit www.saucedemo.com and test the main features of the site when logging in as standard_user, and record the completed test cases and results
|
Cursor will use the default large model to make an execution plan, and automatically open the browser through devtools mcp and complete the subsequent execution
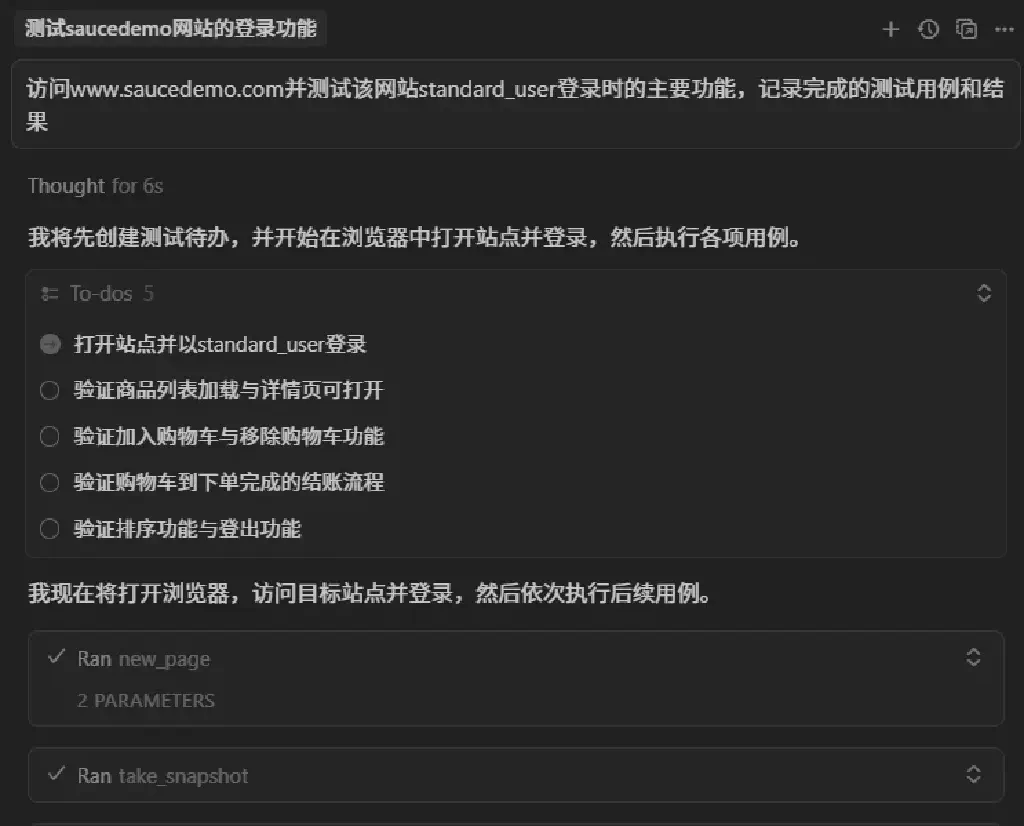
Launch the browser and execute
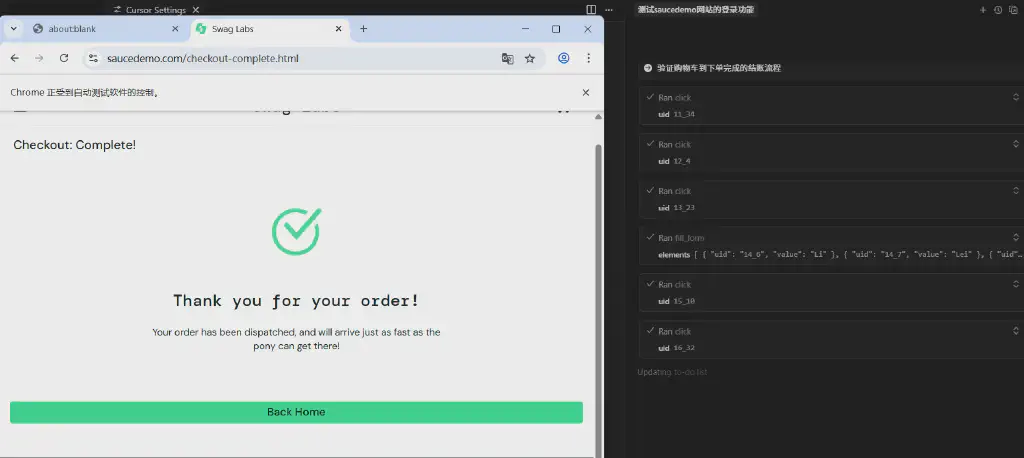
On the first run, the following result was obtained
 1
 2
 3
 4
 5
 6
 7
 8
 9
10
11
12
13
14
15
16
17
18
19
20
21
22
23
24
25
26
27
28
29
30
31
32
33
34
35
36
37
38
39
40
41
42
43
44
45
46
47
48
49
50
51
52
53
54
55
56
57
58
59
60
61
62
63
64
65
66
67
| ### Test Scope
- Site: https://www.saucedemo.com/
- Account: standard_user / secret_sauce
- Browser: Desktop (real site interaction)
### Test Cases and Results
- Login success
- Steps: Enter username standard_user and password secret_sauce, click login
- Expected: Enter the product list page
- Result: Passed (entered the "Products" list page)
- Product list loading and detail page
- Steps: View product cards on the list page, click Sauce Labs Backpack to enter details
- Expected: Show name, description, price, and action buttons
- Result: Passed (detail page displayed completely, returning to the list works)
- Add to cart and remove
- Steps:
- Perform "Add to cart/Remove" on the Backpack on the detail page
- Perform "Add to cart/Remove" on the Bolt T-Shirt on the list page
- Expected: Cart badge count changes correctly; the cart page shows items and supports removal
- Result: Passed (badge count changes correctly; the cart page shows two items and supports removal)
- Checkout flow (from cart to order completion)
- Steps: Cart -> Checkout -> Fill First/Last/Zip -> Overview -> Finish
- Checkpoints: Amount summary (subtotal/tax/total) displayed; completion page shows "Thank you for your order!"
- Result: Passed (completion page displayed successfully, returning to home works)
- Sorting feature (to be completed)
- Goal: Switch the filter dropdown from "Name (A to Z)" to "Price (low to high)", and verify that products are sorted by price ascending
- Current status: Dropdown expanded but interaction timed out, final verification not completed
- Result: Pending
- Logout feature (to be completed)
- Goal: Via the top-left "Open Menu" -> "Logout"
- Current status: Not yet executed
- Result: Pending
### Conclusion
- Passed: Login, list and details, cart add/remove, complete checkout.
- Pending: Sorting verification, logout.
|
As can be seen, the expected execution task was completed successfully.
Compared with other upper-layer tools like Playwright-mcp, Chrome DevTools, calling directly from the browser’s lower layer, should be faster and more accurate in execution, and should also be friendlier in token consumption when interacting with large models.
Page Performance Assessment
Besides calling the browser to access pages, because DevTools MCP calls the underlying methods directly, it can also provide performance data, console information, and so on that other AI browser tools find hard to collect directly, greatly facilitating AI’s more comprehensive operation of the browser and our completion of lower-level tasks.
For example, we can complete a page performance assessment test task, taking the assessment of my blog as an example:
1
| Visit @https://chengxiaqiucao.github.io/ and assess the performance of this website
|
After execution, you can see that the underlying performance assessment methods provided by DevTools can be called and executed.
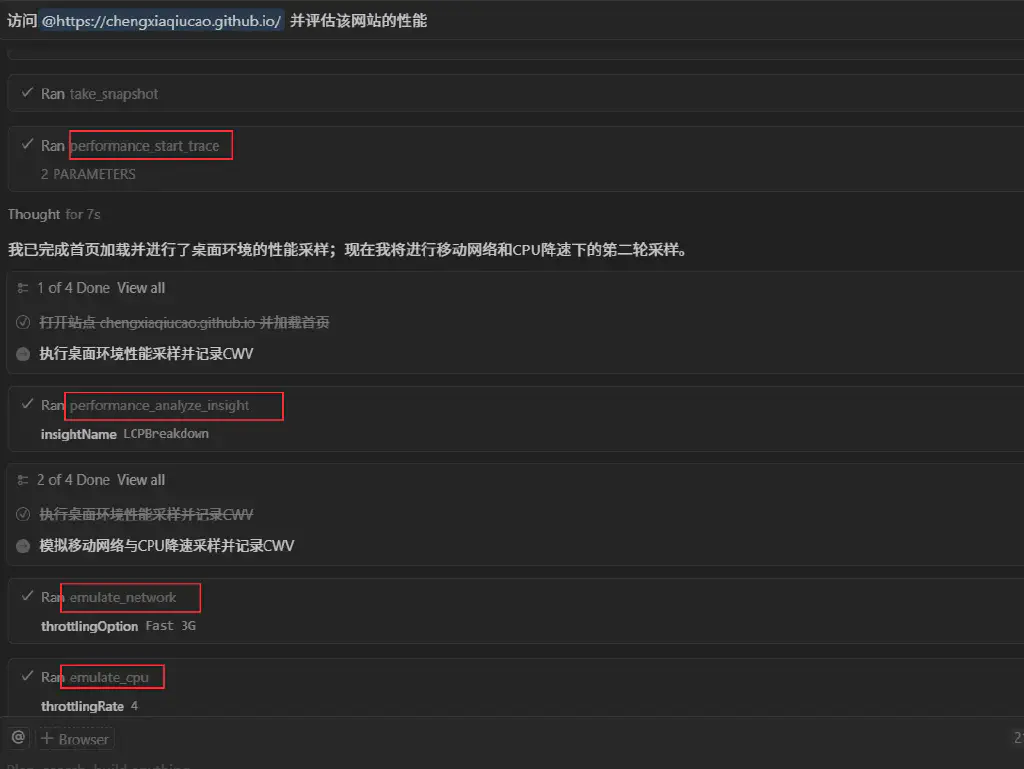
Finally, the following result was obtained:
 1
 2
 3
 4
 5
 6
 7
 8
 9
10
11
12
13
14
15
16
17
18
19
20
21
22
23
24
25
26
27
28
29
30
31
32
33
34
35
36
37
38
39
40
41
42
43
44
45
46
47
48
49
50
51
52
53
54
55
56
57
58
59
60
61
62
63
64
65
66
67
68
69
70
71
72
73
74
75
76
77
78
79
80
81
82
83
| ### Assessment Target
- Site: https://chengxiaqiucao.github.io/ (Hugo + Stack theme)
- Reference source: The site's public content and this sampling result
- Homepage content reference: Qiucao's Testing Observation
### Key Metrics (Lab)
- Desktop environment (no throttling/no slowdown)
- LCP: 477 ms (largest contentful paint is the homepage hero image, IMG)
- CLS: 0.00
- Simulated mobile (Fast 3G + CPU 4x slowdown)
- LCP: 918 ms
- CLS: 0.00
- LCP breakdown (desktop sample)
- TTFB: 6 ms
- Resource discovery/loading: 29 ms (discovery 24 ms, download 5 ms)
- Render delay: 442 ms (~92.6%)
- LCP element: post/123-markitdown/Pasted-20250907_...png (non-blocking load, h2, 200)
The data above comes from this lab sampling; there is no CrUX field data in the actual measurement. Reference pages and content come from elements such as the site homepage navigation and article cards; see the site homepage content snapshot and link: site homepage.
### Conclusion
- Excellent metrics: LCP < 1s (desktop/mobile), CLS = 0, overall loading chain is simple (static site, CDN caching effective, h2).
- The main bottleneck is "render delay", not network or resource download. This shows the first screen is mainly spent on style computation/layout/paint, not the request chain.
### Suggested Optimization Directions (by priority)
- Critical rendering path optimization
- Optimize the first-screen DOM size and style complexity to reduce reflow/repaint overhead (list cards, image container shadows/rounded corners/filters, etc. can be reviewed).
- If web fonts are used, ensure font-display: swap to avoid render delay caused by delayed first-screen text painting.
- Image strategy
- Keep the LCP image "accessible" and non-lazy-loaded; if the size is too large, consider explicit width/height dimensions and priority hints (for supported frameworks).
- Enable lazy loading loading="lazy" and decoding="async" for non-first-screen images to reduce first-screen decoding and layout pressure.
- CSS and third parties
- Split CSS reasonably, ensure first-screen critical styles are inlined or prioritized, reducing render blocking.
- Review third-party scripts and analytics, defer non-critical script execution or use defer/async, keeping the main thread for first-screen painting.
- Caching and delivery
- Keep long caching for static assets (cache-control: max-age=600, etc. already seen); if content is stable, it can be extended with fingerprints.
- Confirm images are delivered via adapted formats (such as WebP/AVIF) with appropriate resolution/compression.
### Suggested Follow-up Verification
- On real mobile devices, use Lighthouse to test "cold start/second visit" separately, focusing on FCP, INP, and LCP fluctuations.
- Repeatedly sample different article pages (containing many images/code blocks), observing whether the LCP element changes and whether render delay increases.
- Introduce a performance budget, set thresholds for image size, CSS/JS size, and request count, and check automatically in CI.
### References
- Site: chengxiaqiucao.github.io
- Site content overview: Qiucao's Testing Observation
- LCP optimization: Optimize LCP
- Critical rendering path: Understanding the critical path
|
Conclusion
Through the above attempts, we can see that Chrome DevTools MCP, in driving the browser to execute via AI, not only has the automated intelligent execution capability we emphasized before, but also has lower-level “debugging” and “diagnosis” capabilities. When selecting AI automation tools, it is worth considering as a preferred direction.