In enterprise management and software development, we often need to sort out various business processes, and flowcharts are an essential tool for doing so, as well as the output of that effort. However, the appropriate type of flowchart varies from one situation to another. In this article, let’s summarize the 8 most common flowchart types together.
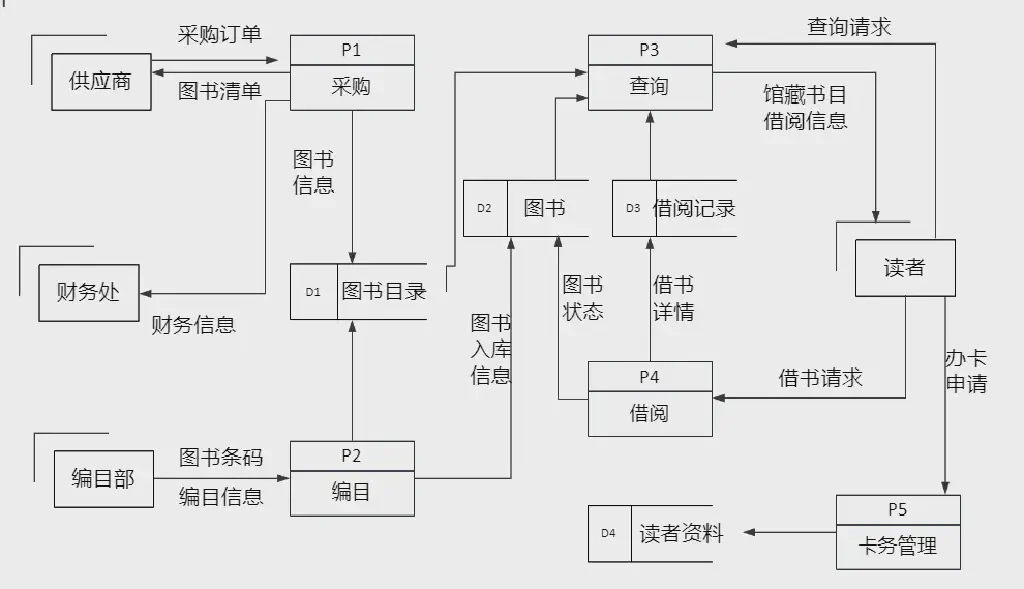
Data Flow Diagram
Data Flow Diagram It is a diagram used to describe the flow and processing of data within a system. It is generally used mainly to analyze and design information systems, helping to understand system functions as well as the input, output, and storage of data.
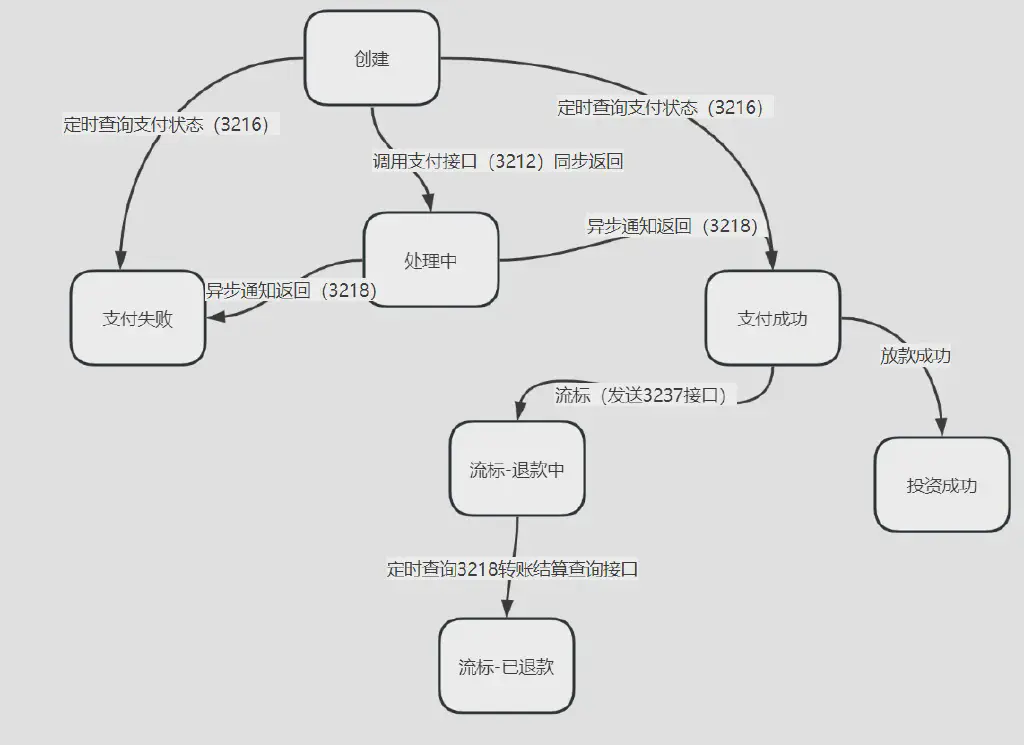
State Transition Diagram
State Transition Diagram It is typically used when a business object has many different states, in order to sort out the transition relationships between states and their trigger conditions. For example, the state transitions of an order:
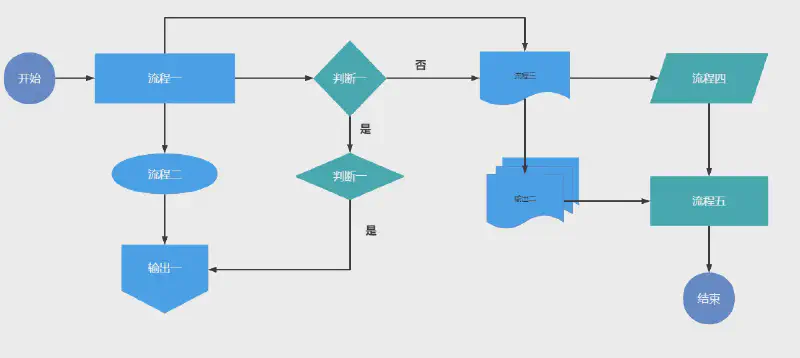
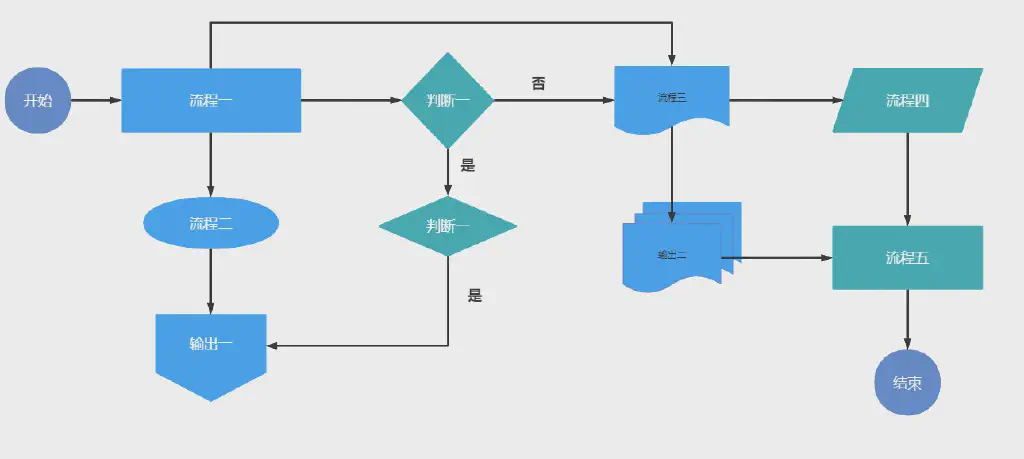
Process Flow Diagram
Process Flow Diagram This is what we usually refer to as a general flowchart. It is a diagram used to describe and analyze business processes, workflows, or system operations. Through graphical symbols and connecting lines, it shows the various steps of a process and their sequence, helping to understand and optimize the process.
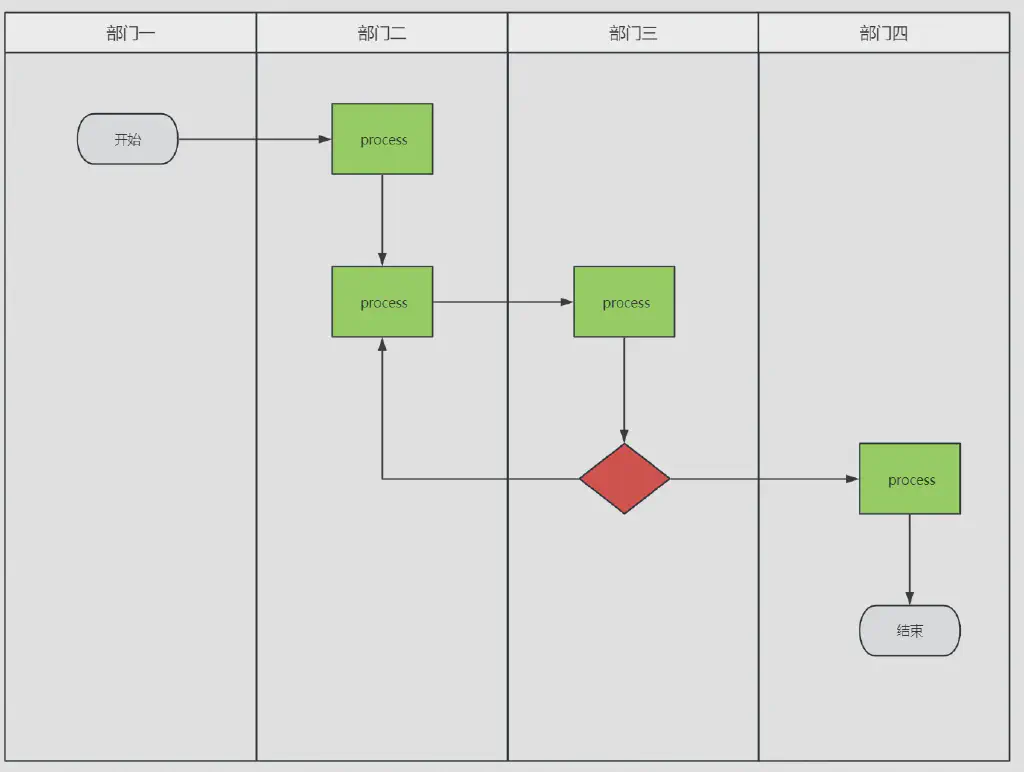
Swimlane Diagram
Swimlane Diagram It is a diagram used to describe and analyze cross-departmental or cross-functional processes. By assigning different “swimlanes” to participants or departments, a swimlane flowchart clearly shows the roles and responsibilities of each party throughout the entire process.
Workflow Diagram
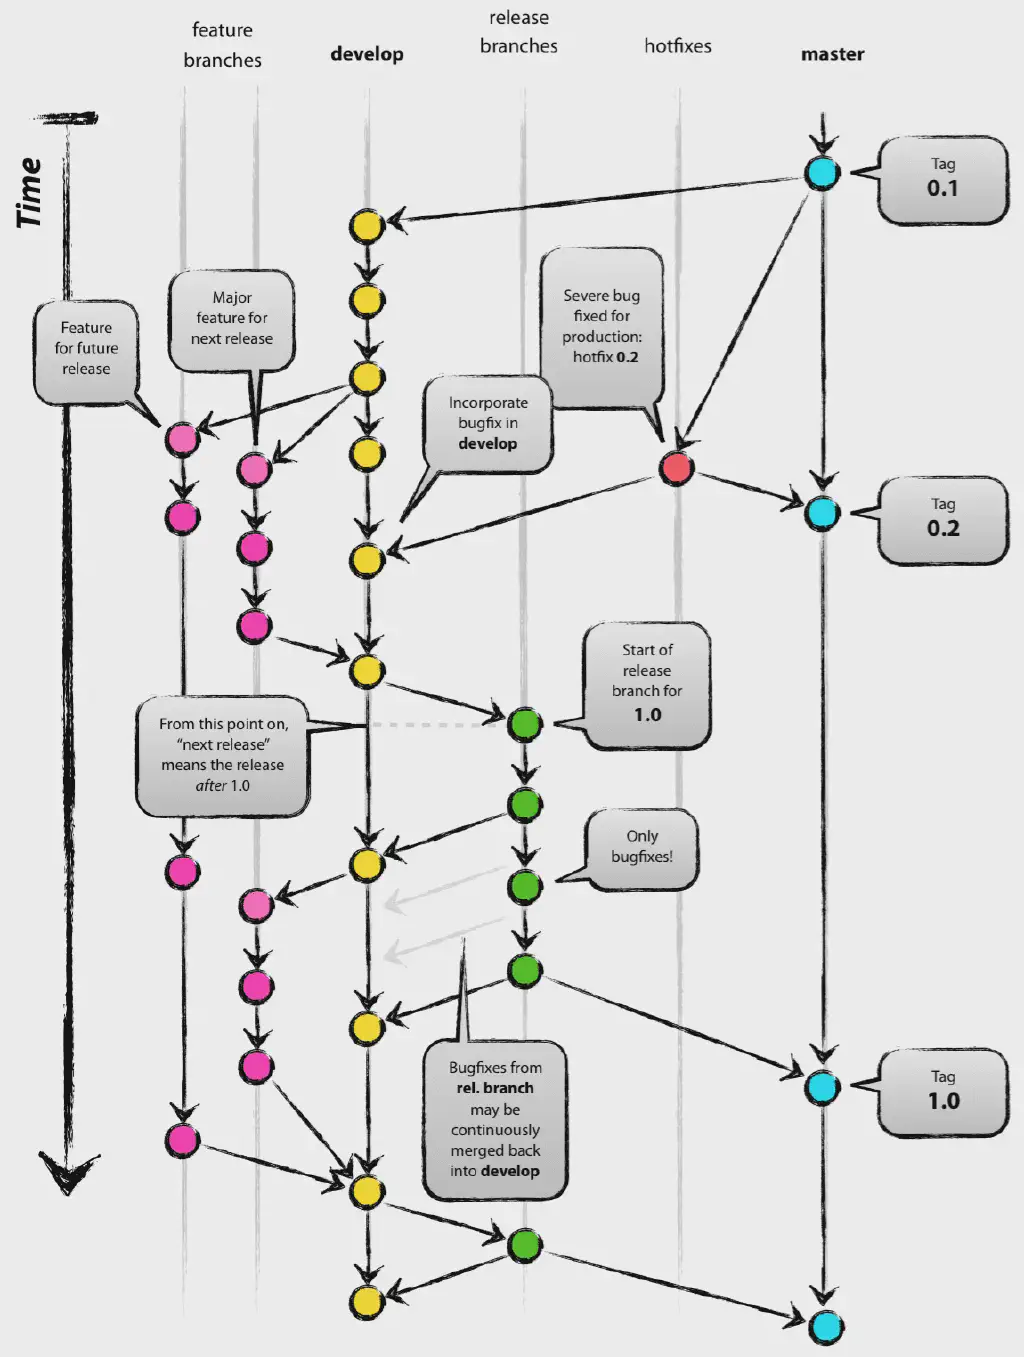
Workflow Diagram It is a diagram used to describe workflows and business processes, typically used to show the sequence of tasks, the roles of participants, and the logical relationships between tasks. It helps teams understand and optimize workflows and ensures tasks are executed efficiently.
For example, gitflow in code version control management is a typical workflow diagram.
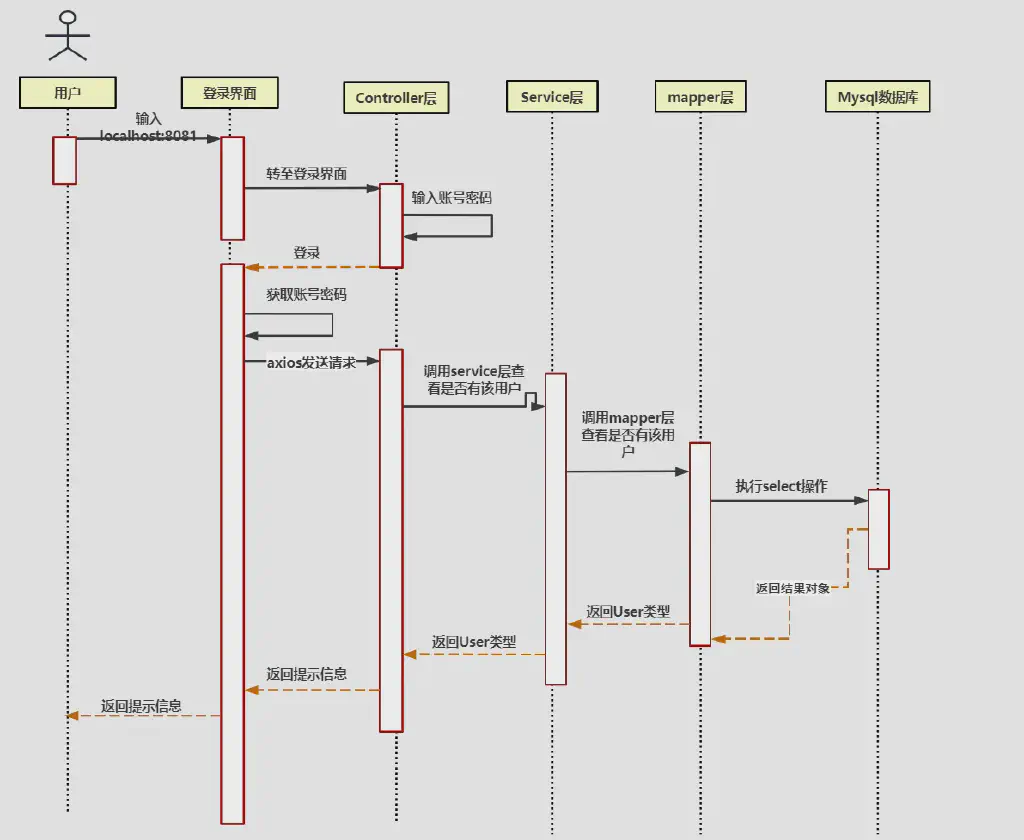
Sequence Diagram
Sequence Diagram It is a diagram used to describe the interactions between objects, with a particular emphasis on time order. It is typically used to model the dynamic behavior between objects or components in a system, especially in software engineering and system design.
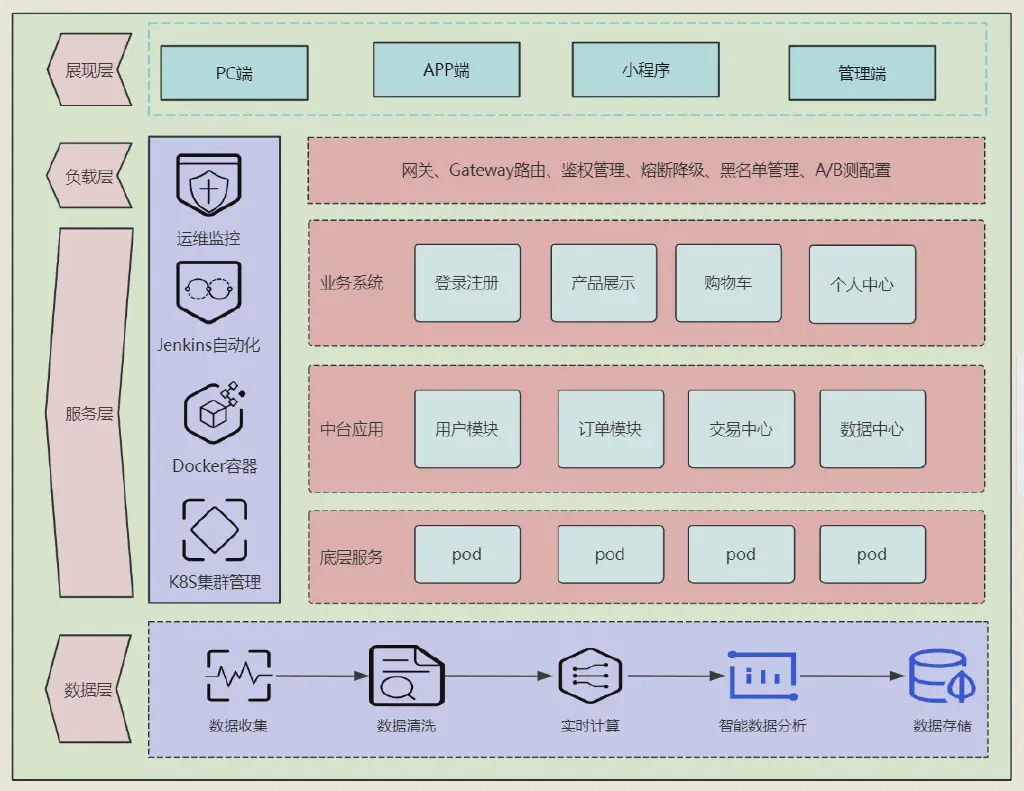
System Architecture Diagram
System Architecture Diagram It is a diagram used to describe the relationships and interactions between the various components of a system. It provides an overall view of the system, helping development teams, project managers, and stakeholders understand the system’s structure and design.
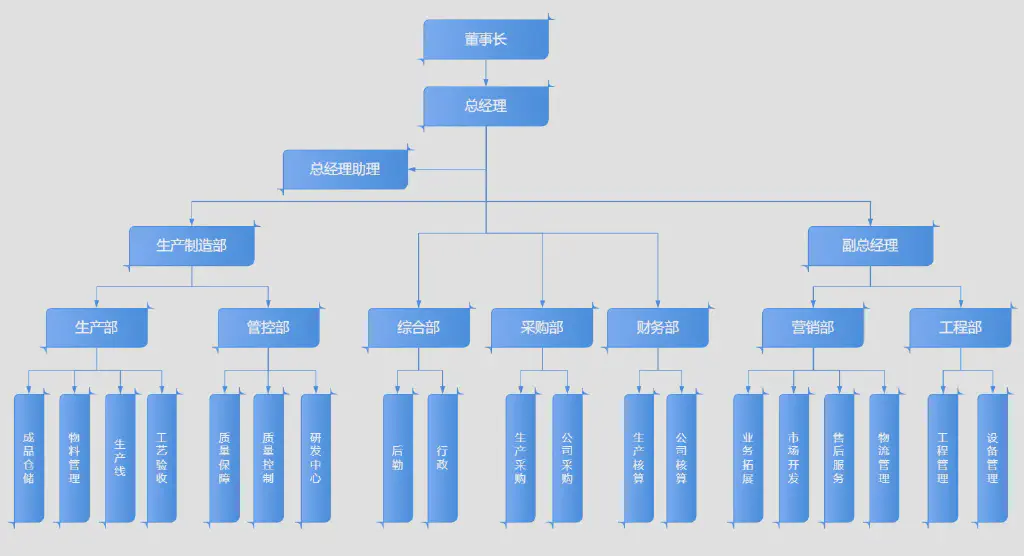
Organizational Chart
Organizational Chart It is a diagram used to show the various departments and positions within an organization and their relationships. It helps employees, management, and stakeholders understand the organization’s hierarchical structure and working relationships.